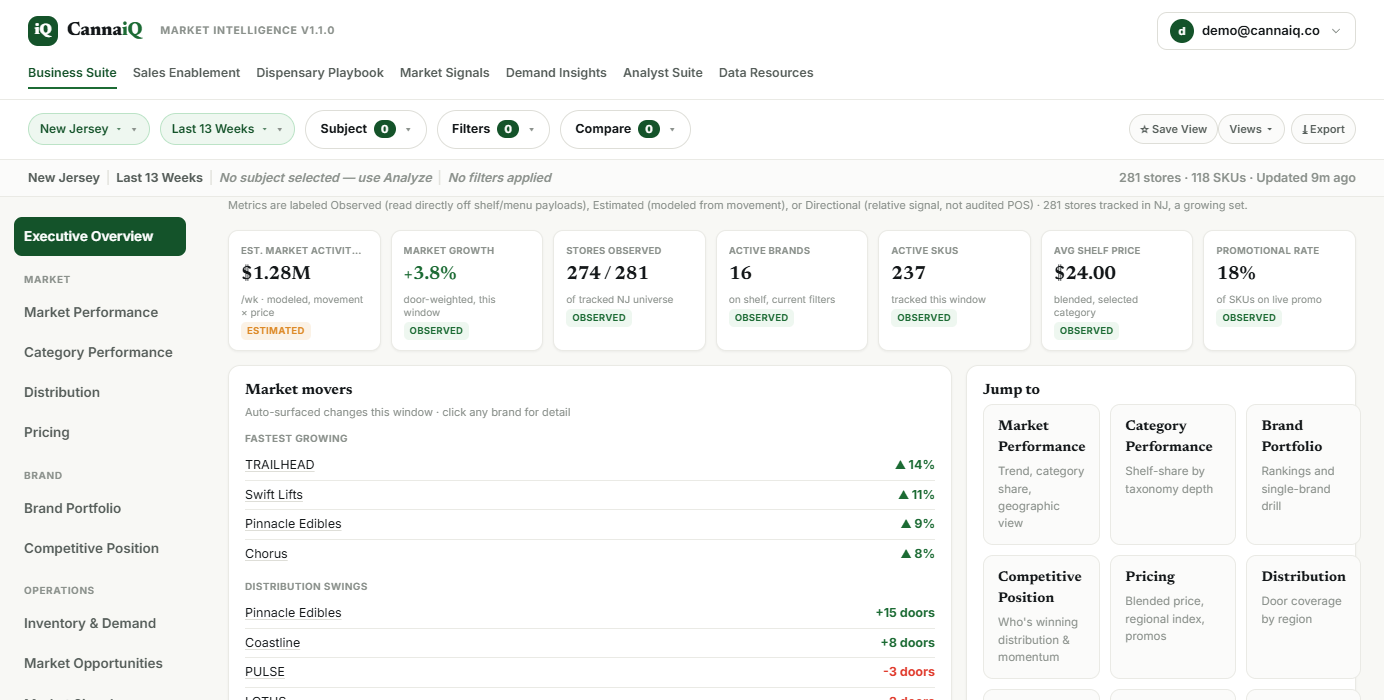
Share, pricing, distribution and demand for every brand and store we track, rebuilt from the live shelf several times a day. The answers panel subscribers wait weeks for, at a price that doesn't need a board vote.
No panels to extrapolate from and no surveys to wait on. Every insight traces back to what was actually on the shelf.
We read dispensary menus directly, multiple times a day: every product, price, promo and availability change, across the stores we track.
Our analytics layer unifies every product, brand and store into one consistent record with full history, so a brand reads the same in every store and every state.
Market share, pricing position, distribution, demand momentum and who to call next, ready the moment you open it.
The same questions legacy providers answer, from fresher data, at a fraction of the price.
POS data from opt-in retailers, updated weekly.
Daily menu snapshots.
POS sales panel and consumer research, delivered as reports.
Menus observed multiple times a day, composed into a full analytics layer. Every suite included.
Competitor pricing reflects typical published or reported ranges and varies by contract.
Your plan sets which states you analyze. Everything else is included at every price.
The state of a market at a glance, then drill into any category, brand or region.
Pick a brand or SKU and find the accounts, whitespace and territories to go after.
Any store against its local market: assortment, category mix, pricing and promos.
What's accelerating: emerging brands and products, distribution expansion, pricing moves.
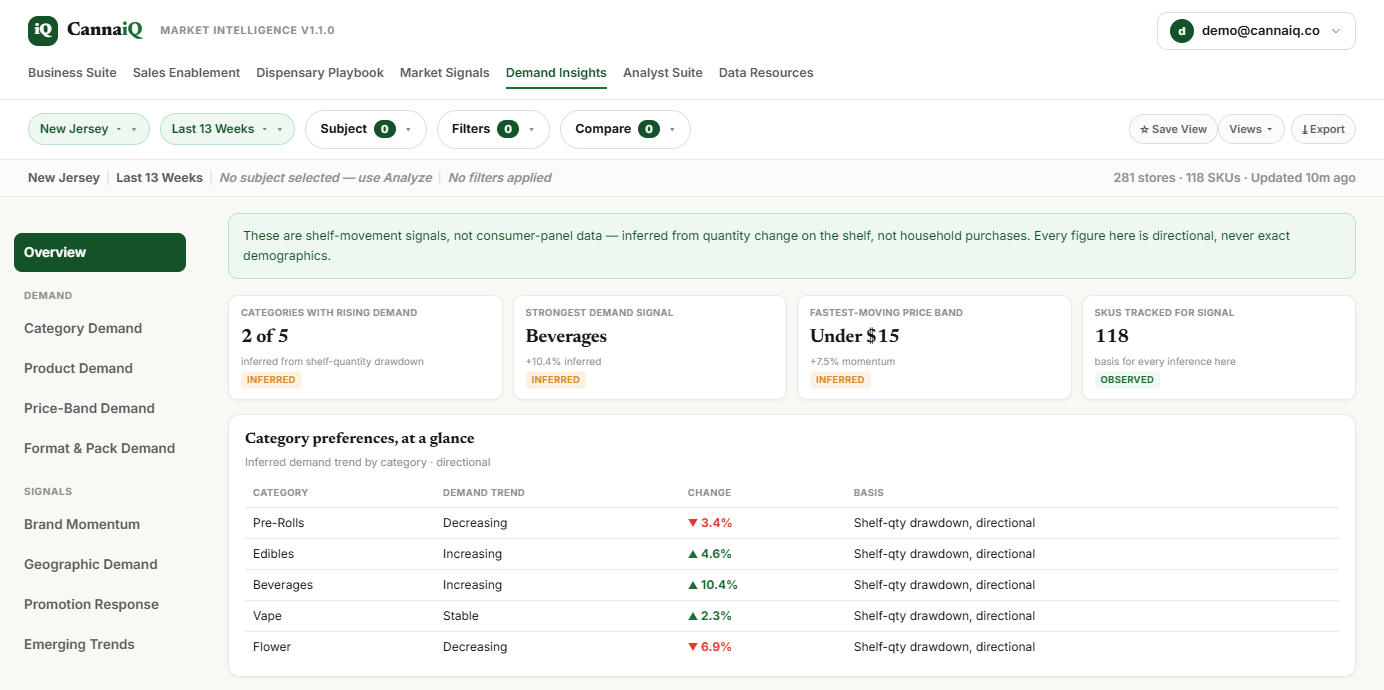
Directional demand by category, price band, format and region, inferred from shelf movement.
Open-ended exploration across markets, brands and stores. Save it, schedule it, export it.
Save any view, send reports on a schedule, and get alerted when the numbers you watch change.
How every number is made: coverage, methodology, glossary, taxonomy and freshness.
We watch the shelf multiple times a day, so you see what's moving now, not last quarter. Spot the categories, price bands and brands gaining momentum in every state you track, and act on it first.
See where any brand wins and loses across stores, categories and price points.
Benchmark assortment, pricing and promos against the stores around you.
Spot brands and products gaining distribution before the rest of the market does.
Explore markets, cohorts and trends with every metric's method documented.
Find accounts, whitespace and call priorities for the brand you're selling.
The more states you add, the lower the per-state rate. Your price follows your total state count.
Enterprise covers custom access, more users and an SLA, priced to your team.
Brand, Retailer and Supplier Intelligence are built around your own brand, store or pipeline. Market Intelligence is neutral: you analyze any brand, store or category in the states you license. They solve different jobs and are priced separately.
No, and that is the advantage. POS panels only see the stores that share data, on a delay. We read dispensary menus directly, multiple times a day, so you see every brand on the shelves we track, including competitors, with no integration.
Only the states you can analyze. Every tier includes every suite: Business Suite, Sales Enablement, Dispensary Playbook, Market Signals, Demand Insights, Analyst Suite, Saved and Scheduled, and Data Resources.
Yes. Your price follows your total number of states: $495 for one, $395 per state for 2–4, $295 per state for 5–9, or $2,995 for all supported U.S. markets. You see the new total before you confirm.
Market Intelligence comes with a 10-day free trial. A card is required to start.
No. The CannaiQ Data API is a separate product with its own plans and keys. Dashboard use never consumes API quota.
10 days of full Market Intelligence in the state you choose.