HOURLY
The market, as it moves.

See the shelf.
See what's next.

CannaiQ watches products, prices, promotions, availability, and competitive movement across the cannabis retail market—so you can see change while it still matters.

One view across the United States, Canada
and Puerto Rico.
🇺🇸🇨🇦🇵🇷
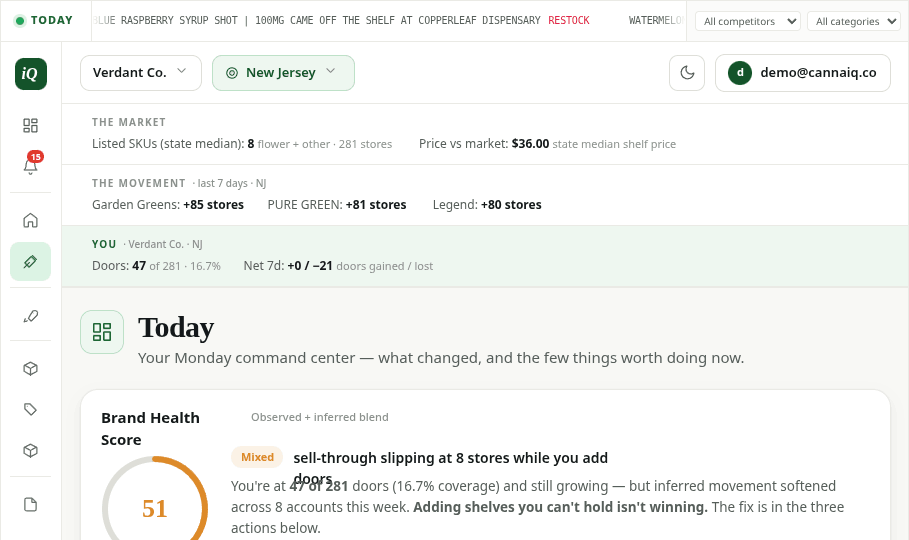
CannaiQ brand dashboard — today
NEW ALERTRead hourly
Cloudline entered Highland HOC
12 SKUs · Vapes · undercutting your avg by 15%
11,609
Dispensaries observed
3M+
Products monitored
55
Markets covered
One market. Two ways in.

Use the intelligence.
Or build with the data.

The same CannaiQ market engine powers both. Choose the finished intelligence your team can use now, or bring the underlying market data into your own stack.

Use CannaiQ

Answers, ready to use.

For brands, retailers, and suppliers that need to understand the market, find opportunity, and act without building the data layer themselves.

  • Intelligence built for brands, retailers, and suppliers
  • Competitive, distribution, pricing, inventory, and opportunity views
  • No POS integration required
Build with CannaiQ

The market, in your stack.

For data teams, analytics platforms, and enterprise products that want CannaiQ's observed and organized retail data inside their own systems.

  • Current and historical shelf data
  • API and bulk delivery
  • Market and freshness metadata
Built around your side of the market

Same market.
Different questions.

CannaiQ changes the view around what you need to decide—whether you're earning the next shelf, running the shelf, or finding the businesses behind it.

CannaiQ brand dashboard

For Brands & Producers

Know where to grow. And what could get in the way.
  • Find stores and markets where your brand fits
  • See where distribution is expanding or slipping
  • Watch competitive products, pricing, and promotions
  • Understand shelf position down to product and SKU
  • Surface opportunities for your sales team
  • Keep territories focused on what changed
Explore Brand Intelligence
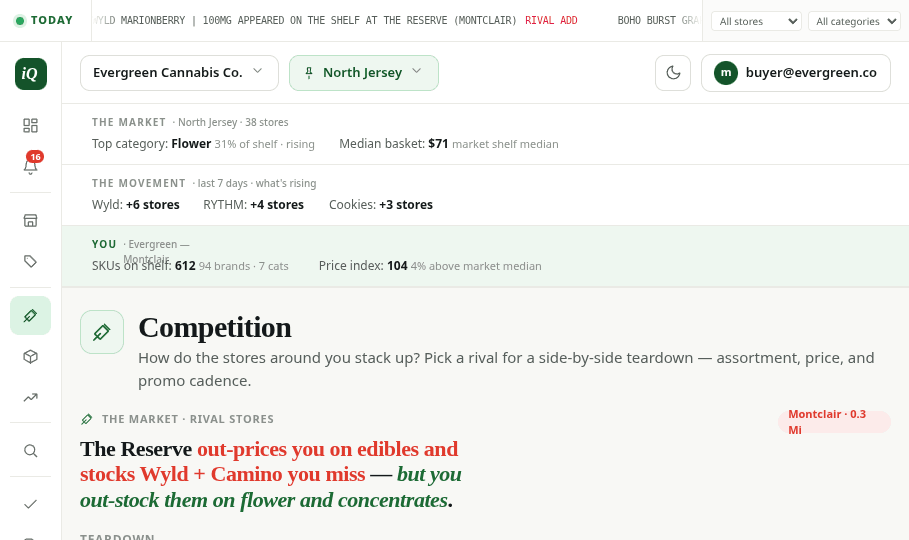
CannaiQ retail dashboard

For Dispensaries & Retailers

Know your shelf. Know the one down the street.
  • Compare assortment with nearby competitors
  • Benchmark pricing and promotional activity
  • See brands and products entering your market
  • Find assortment gaps and local opportunities
  • Watch availability and out-of-stock signals
  • See meaningful shelf changes as they happen
Explore Retailer Intelligence
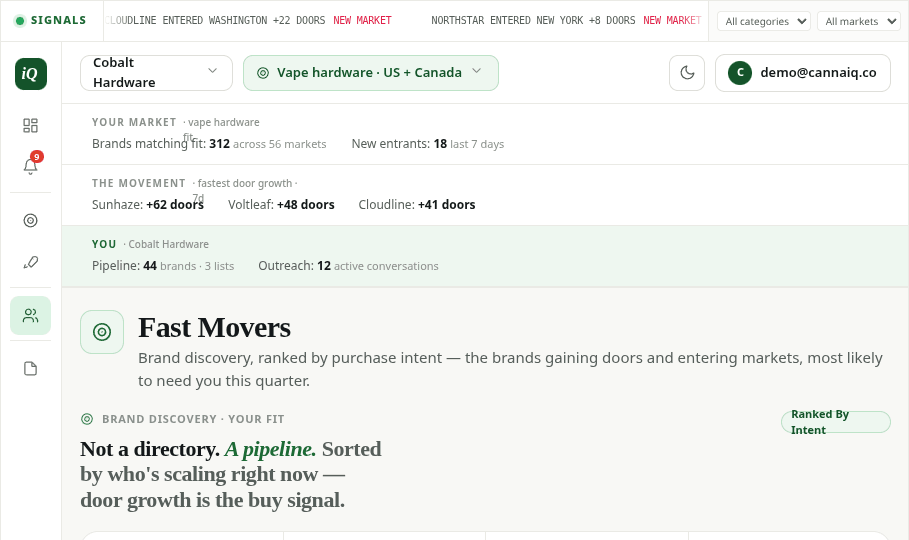
CannaiQ supply dashboard

For Suppliers & Service Providers

Find the businesses shaping the market.
  • Discover brands across markets and categories
  • See where brands are carried and expanding
  • Identify active and emerging businesses
  • Find gaps in your current customer universe
  • Build prospect lists from market evidence
Explore Supplier Intelligence
04A DIFFERENT KIND OF MARKET INTELLIGENCE

Don't just study the market.
Know where to move.

From visibility to action

Traditional market intelligence helps you understand what happened. CannaiQ is built to keep the next question close: where is distribution changing, who is competing for the shelf, what changed, and where should you look next?

Capability
CannaiQ
HeadsetHoodie
Shelf updatesHourlyDailyDaily
Markets coveredUnited States, Canada, Puerto RicoUnited States, CanadaUnited States, Canada
Expansion targets with scoringScored
Win attribution (automatic)Auto
Competitor entry alertsSKU-levelPartial
POS integration requiredNoYesNo
Retailer starting price$149/mo flat$250/mo~$1,000/mo
Brand starting price$495/mo flatCustom ($1,500+)~$2,000/mo
No POS integration required.Compare CannaiQ
The CannaiQ difference

More of the market.
Closer to the decision.

CannaiQ starts with the retail shelf itself—what is present, what it costs, what is promoted, what is available, and what changes. Then it turns that market view into intelligence your team can actually work from.

What CannaiQ sees.

A continuously observed view of the market outside your four walls.

  • Products and assortment
  • Distribution and shelf presence
  • Pricing and promotions
  • Availability and inventory signals
  • Competitive movement
  • Market and account opportunities

The simplest test.

Open CannaiQ with a real decision in mind. Pick a brand, account, market, category, or competitor. See how quickly you can move from "what is happening?" to "where should I look next?"

Market intelligence should shorten the distance between seeing a change and doing something about it.

Market coverage

One market view.
Across North America.

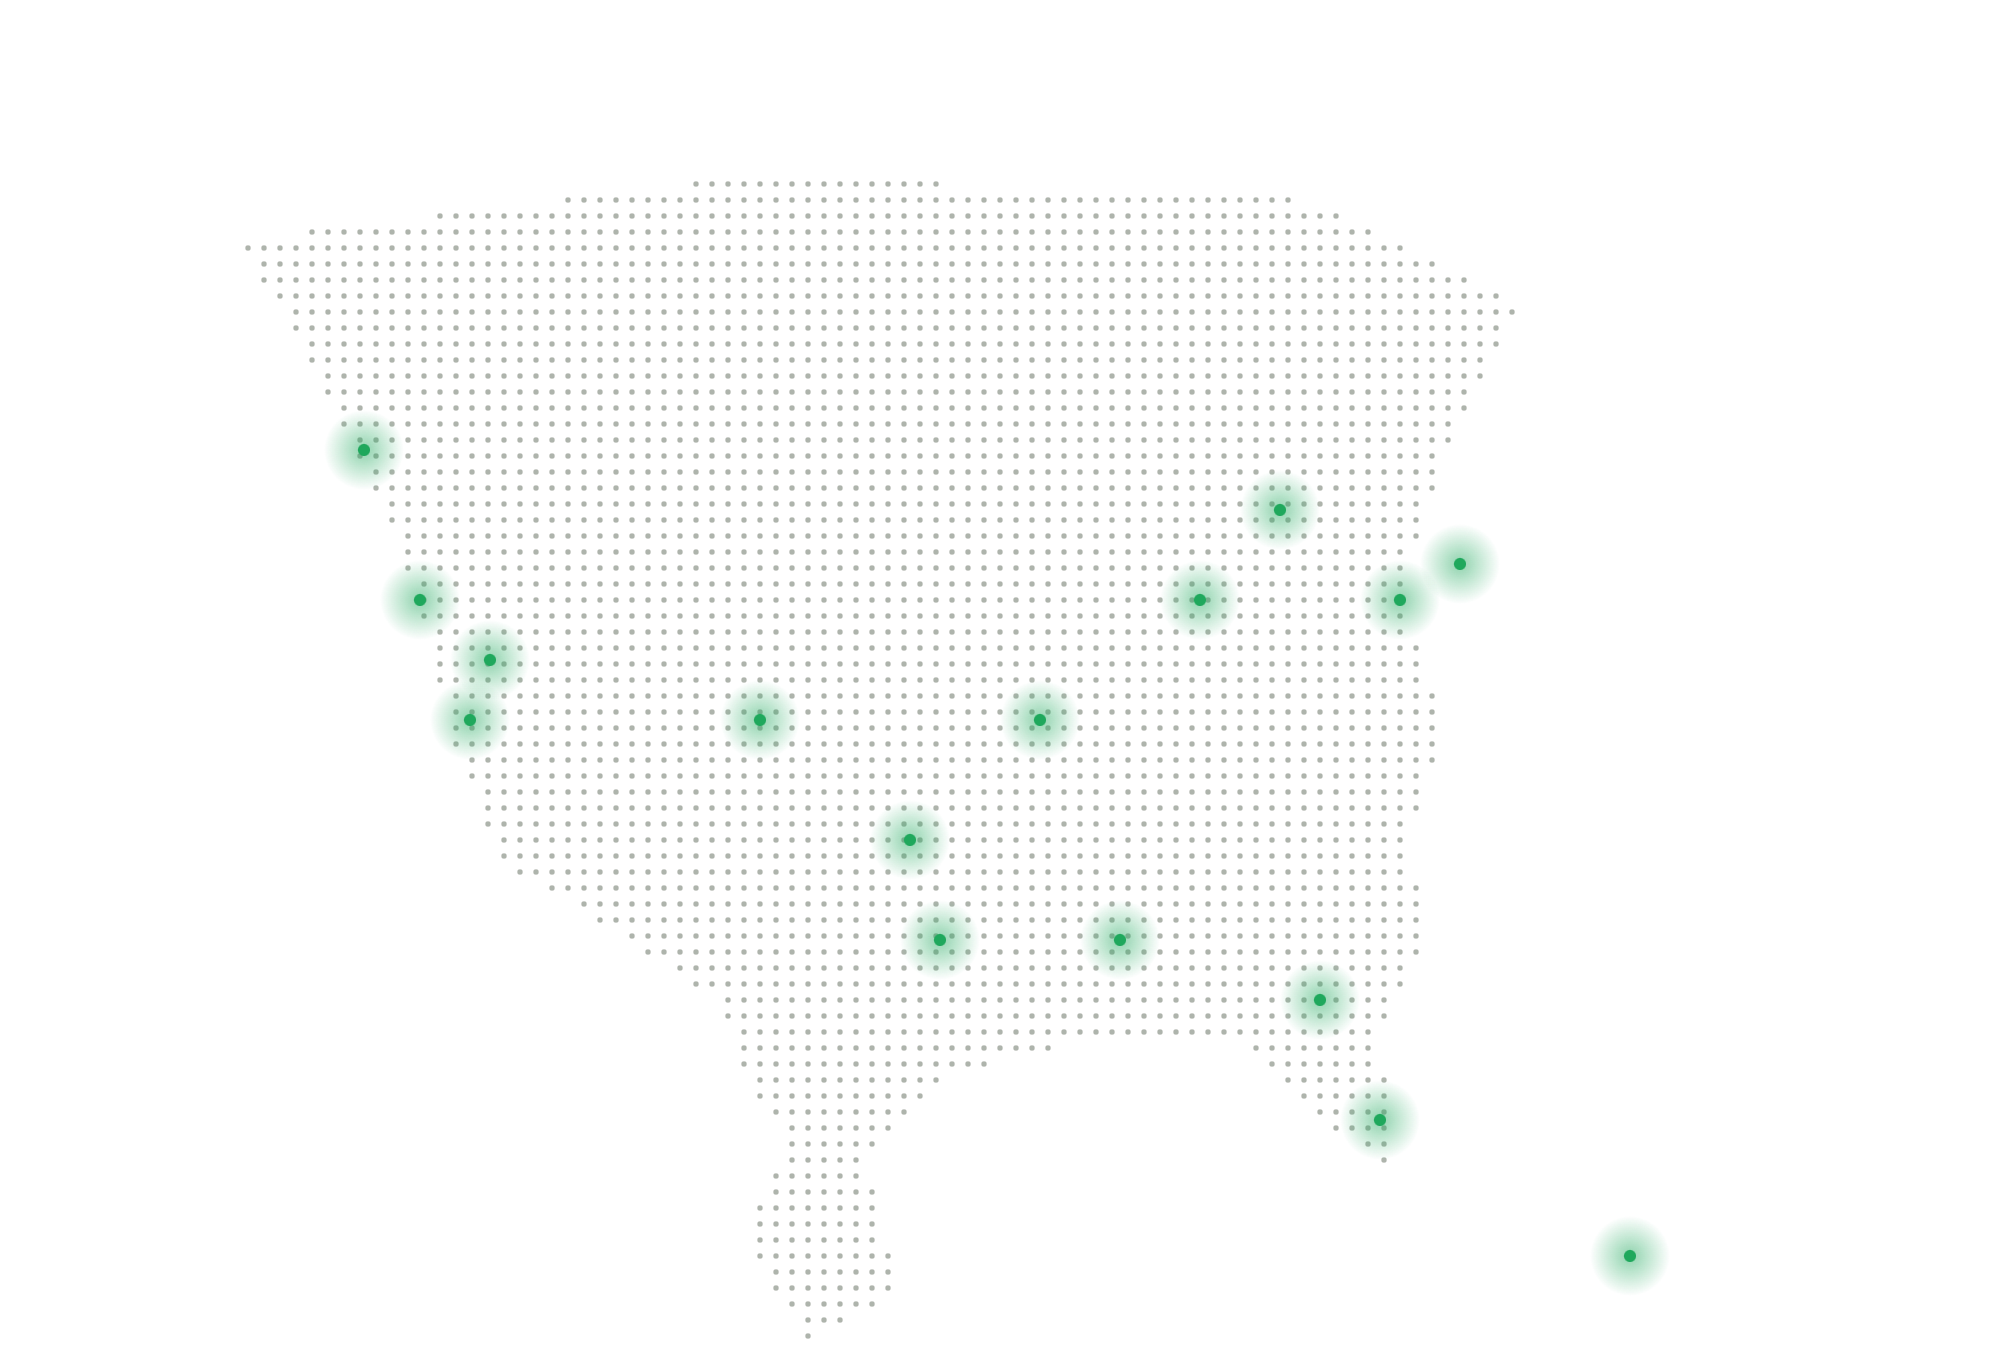
Explore the dispensary shelf across the United States, Canada, and Puerto Rico.

🇺🇸

United States

9,435
DISPENSARIES OBSERVED
California1,141
Michigan788
New York779
Florida776
Oregon565
Colorado544
Massachusetts459
Washington435
New Jersey388
New Mexico330
Montana326
Illinois303
Ohio268
Missouri223
Maine207
Pennsylvania194
Oklahoma192
Arizona189
Maryland177
Minnesota168
Mississippi131
Nevada120
Vermont98
Connecticut88
West Virginia68
Alaska63
District of Columbia58
South Dakota50
Arkansas37
Virginia36
Texas31
Louisiana30
Hawaii27
Kentucky26
Georgia24
North Carolina21
Delaware17
Utah13
Rhode Island11
North Dakota8
New Hampshire7
Iowa5
Nebraska5
Wisconsin5
Alabama4
🇨🇦

Canada

2,145
DISPENSARIES OBSERVED
Ontario1,214
Alberta331
British Columbia269
Quebec112
Manitoba92
Saskatchewan85
Newfoundland and Labrador26
New Brunswick8
Nova Scotia5
Yukon2
Nunavut1
🇵🇷

Puerto Rico

29
DISPENSARIES OBSERVED
Puerto Rico29
Data Platform

Put the market inside your product.

Bring CannaiQ's observed and organized retail data into your warehouse, models, analytics, or customer-facing product through API or bulk delivery.

Current shelf
Historical observations
Change events
Products & SKUs, one record each
Pricing & availability
Bulk data delivery
REST API
Market & freshness metadata
Datasets

Start with the cannabis retail market.

A structured view of the places, brands, products, prices, promotions, availability, and changes that make up the shelf.

Dataset

North American Cannabis Retail

LocationsBrandsProductsSKUsPricesPromotionsAvailabilityHistoryEvents

Want the answer?

Use CannaiQ to explore the market through intelligence built for brands, retailers, and suppliers.

Want the data?

Bring CannaiQ market data into your own warehouse, analysis, or product.

Explore the market

Start with the data.
No signup required.

Browse public CannaiQ market views by geography, brand, category, and dispensary.

Markets

Compare markets by size, growth, and performance.

OVERVIEWAZ
STORES
128 / 312
DROPPED
6
Browse markets

Brands

See top-performing brands and share of shelf.

BRAND HQSHELF SHARE
1Cloudline
19%
2Voltleaf
17%
3Wildroot
11%
4Northstar
8%
5Nova Labs
7%
Browse brands

Dispensaries

Discover top dispensaries and operational benchmarks.

Top dispensary
Red Rock Mesa
Mesa, AZ
CRITICAL
$2.1M
Est. monthly sales
Browse dispensaries

Categories

Explore category trends and product performance.

Flower42%
Vapor24%
Edibles18%
Other16%
Browse categories
The shelf is visible

Stop guessing.
Start knowing.

The cannabis shelf is visible. The question is whether you're looking at it — or your competitors are.